As with virtually all digital scopes on earth, Otii paints graphs with the “connect the dots” approach: to draw a line between consecutive signal samples.
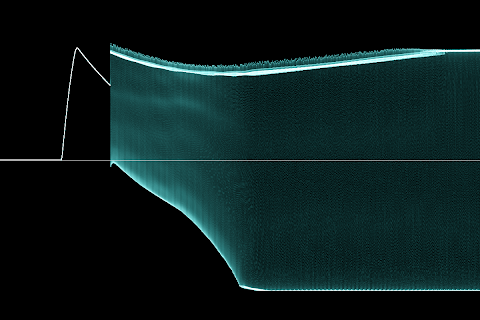
This works almost always. In zoomed-out, very packed signals with lots of switching, the behavior of the signal is almost lost in a mostly solid block of color, victim of visual aliasing: 
Again, this is not the fault of Otii, but from the classic drawing approach.
Well, the other day, while staring a similar graph from my DUT, I suddenly remembered that 6 years ago I read an article in which this problem is solved. The author call this phosphor persistence because it emulates the behavior of old analog scopes. And the result is not only a much more clear signal, but also it is beautiful!

Yes, I realize that the main use case of Otii is measuring energy (integrating the area bellow the curve, which I know it does well) than scrutinizing every single transient peak of the current consumption signal of the DUT. So I’ll understand if this request is sent down to the basement of your backlog. But you have to admit the phosphor behavior looks very cool!